COVID-19 Maps, Widget, Tickers, Charts, Tables Custom Charts, Graphs, Data Tables & GeoCharts!
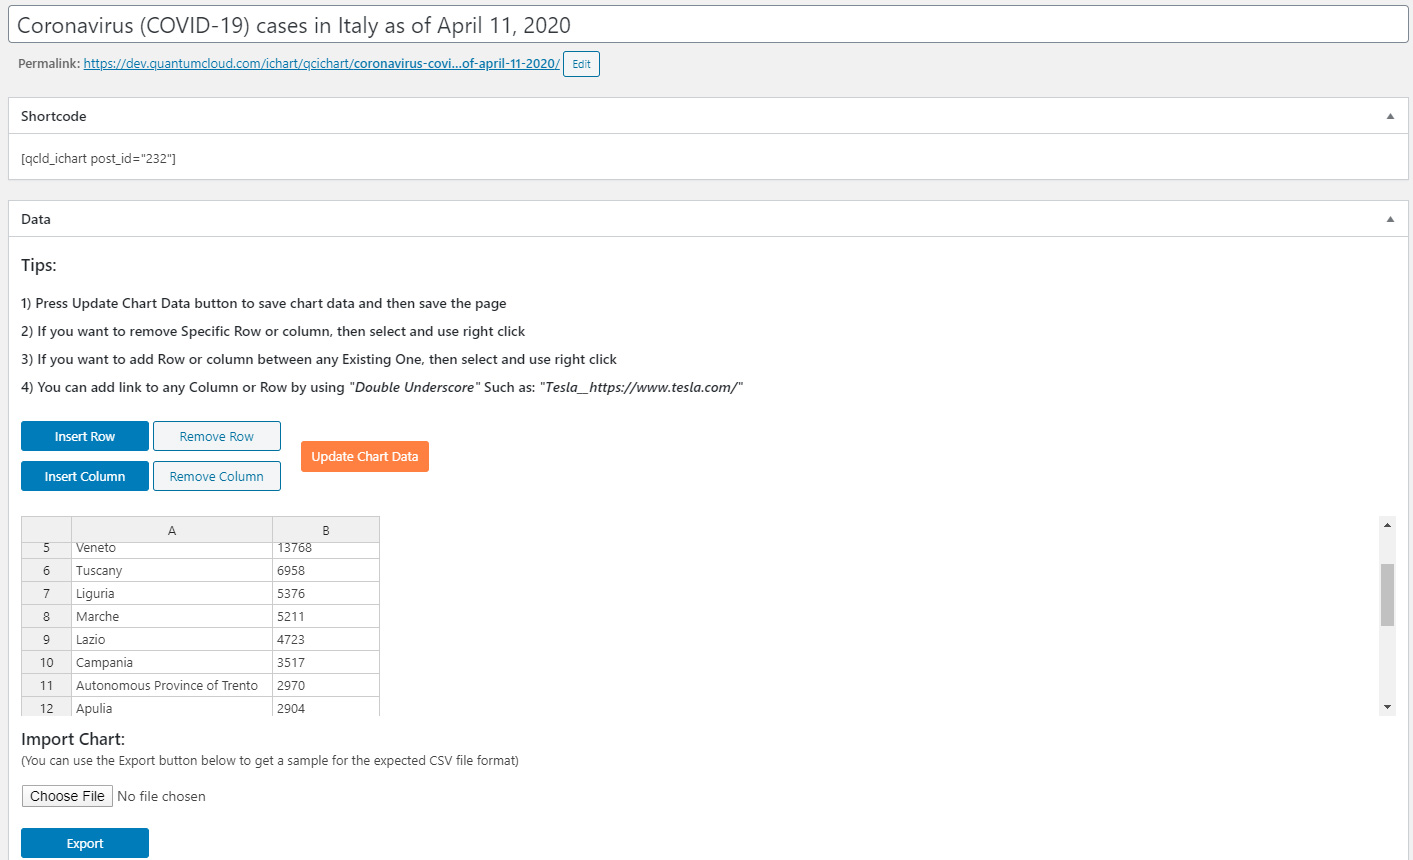
Easily add mapstatistics table and widgets via shortcode to inform your site visitors about changes in the situation about the Corona virus pandemic.

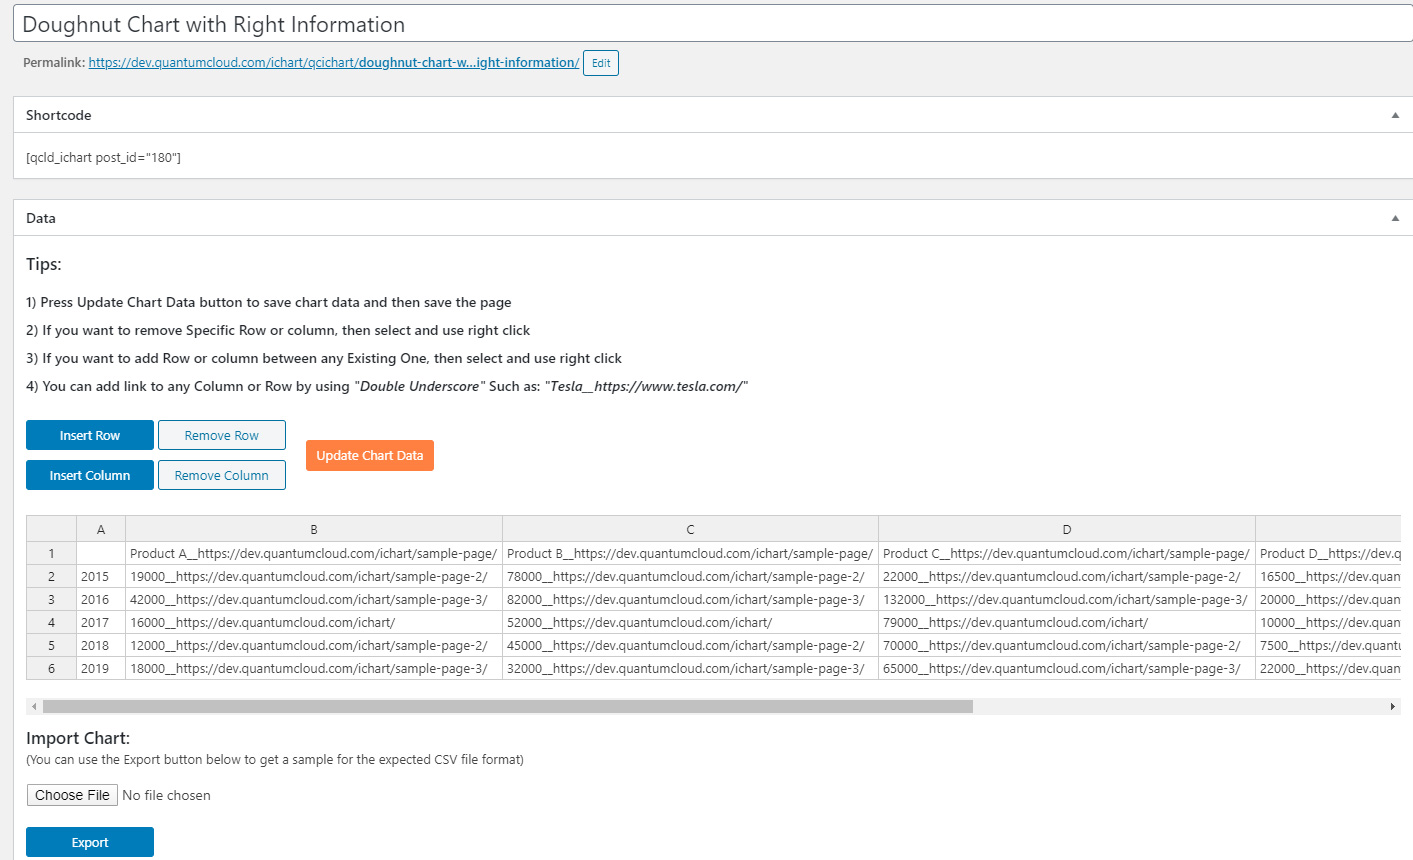
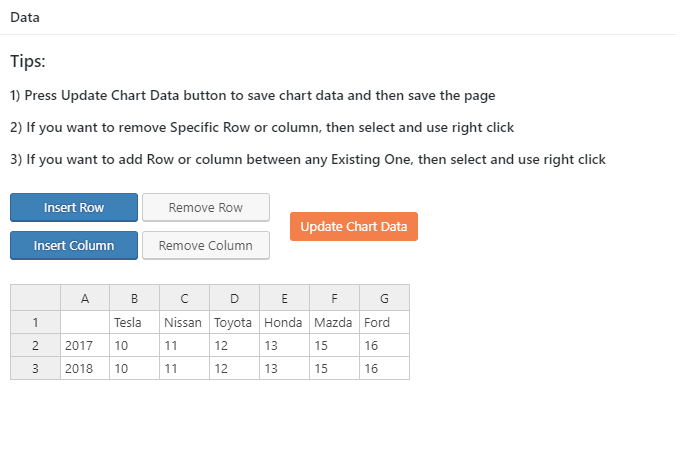
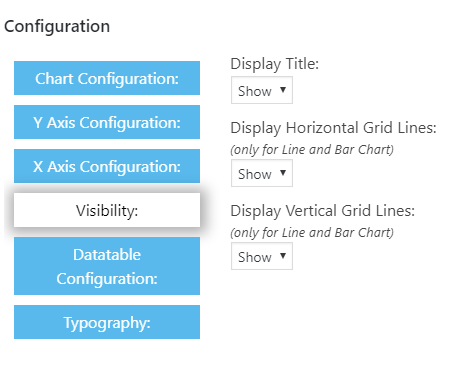
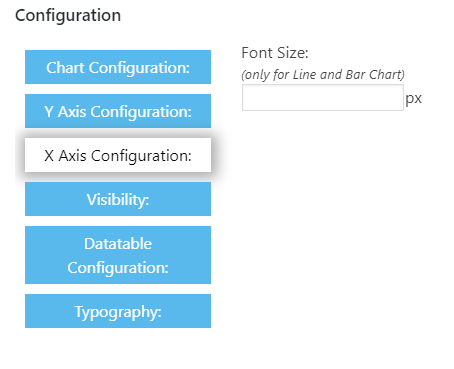
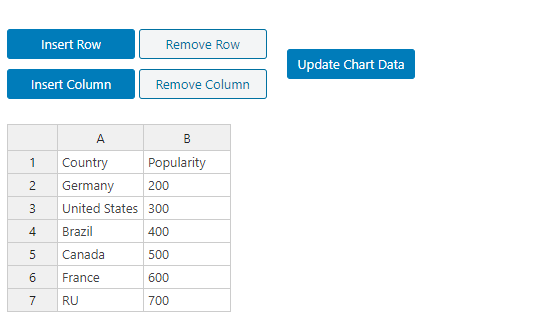
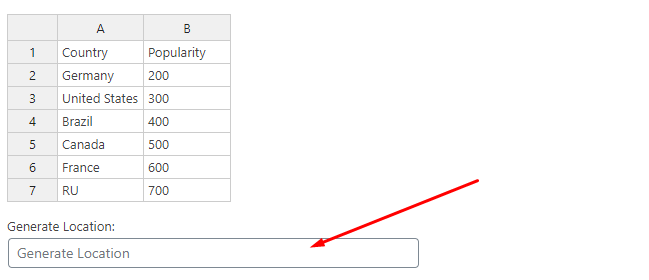
Create Responsive, HTML5 Charts, Graphs and Data Tables are now easy to build and add to any WordPress page with just a few clicks. iChart Pro supports creating standard ChartsGraphs, Data tables as well as GeoCharts to address your data visualization needs.

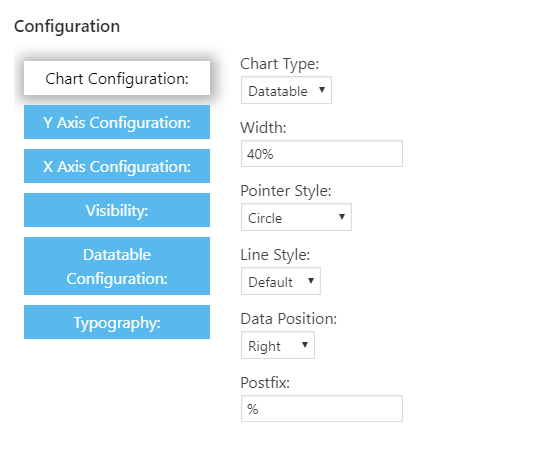
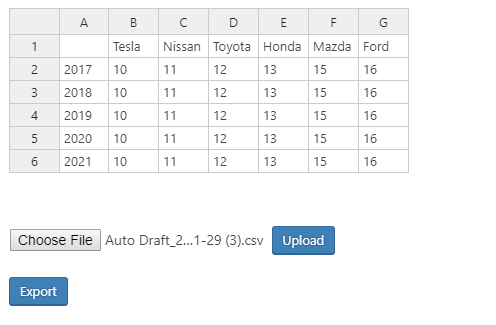
Supports Import/Export Charts, Links in the Chart Data, ToolTip text, Live Chart Preview. Supports embed sharingvisual chart editor, live preview and a lot more!

Backend Sreenshots

Create Quick Charts or Comprehensive Custom Charts

Need to create a chart or graph rather quickly? You can do that right from your WordPress page using the iChart Quick Chart generator. Need to create a comprehensive Chart, Data Table or GeoCharts that you will need to edit later? iChart pro lets you create Charts, Graphs, GeoCharts and Data tables with a Lot of customization options that you can reuse and embed on any page with shortcodes.

Enable the Embed button to let your website users embed the Charts, Graphs and Data tables you created on their own website easily. This unique feature is not available in any other plugin.

iChart utilizes Google‘s Chart.js library to create beautiful, responsiveanimated, HTML5 charts and graphs.

iChart Pro Features:

iChart pro includes all the features of iChart free (the quick and easy on page Chart builder) plus a lot more for more comprehensive and larger charts!

  • Build Pie Charts, Bar charts, Line Charts, Doughnut Charts and Polar Area Charts
  • Create jQuery based Data Tables
  • Use ShortCode with ShortCode Generator to Embed Charts on Any Page Quickly
  • Generate Quick Chart with ShortCode or Save and Reuse Comprehensive Charts
  • HTML5, Responsive and Animated Charts and Graphs
  • Supports Multiple Datasets
  • Create GeoCharts
  • Location auto complete using Google Map API
  • GeoChart Display mode – Regions, Markers, Text
  • Change Data highlight colors for GeoCharts
  • Visual Table Mode to Easily Enter and Edit Chart Data
  • Add/Remove Rows and Columns with Click of Buttons
  • Customize Background Colors for each Dataset
  • Three Positions to Display Chart information Top, Bottom, and Right of the Chart
  • Supports Links for each data
  • Option to hide Chart Information and show only the Chart or Graph
  • Show/Hide Chart Title
  • Supports Custom Text to Show after Tooltip and information
  • Custom CSS to add your own style
  • Full customizable options and control over Typography
  • Customizable Width, Text Color, Font Size, Background Color, Border etc.
  • Show and Hide Horizontal and Vertical Grid lines
  • Import/Export Chart Data
  • Powerful short code Generator for both Gutenberg and Classic Editor
  • Live Chart Preview on Admin after Save
  • Enable Embed Option to allow anyone to embed your chart on their website.

Notice: ob_end_flush(): failed to send buffer of zlib output compression (0) in /home/devquantum/public_html/ichart/wp-includes/functions.php on line 5373